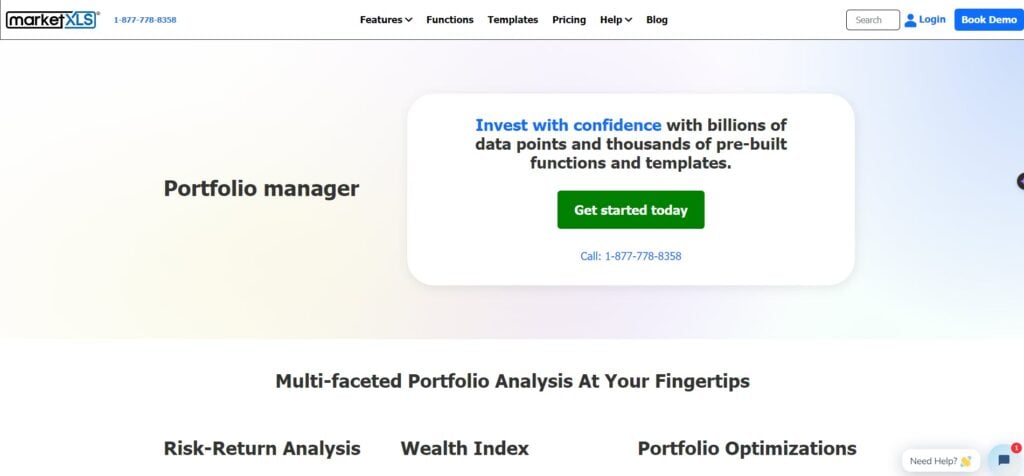
MarketXLS is a tool designed primarily for investors and traders to analyse, monitor, and keep themselves updated data-wise.
The tool is based on Excel and offers such features as easy updation of data, economic data points, various functions and utilities, and templates, among others. These features are helpful not only for pro investors and traders but also for those who are just starting on their journey.
In this article, we’ll explore 10 ways MarketXLS can help you.
Real-time stock prices
If you’re using MarketXLS, you can get live quotes, historical prices, dividends, splits, options, and more for any stock or index.
You can also use MarketXLS to get data from other sources such as Yahoo Finance, Google Finance, Quandl, and Alpha Vantage.
To add real-time data, you can use the function: qm_stream_last(symbol). Once you input the function, the tool will perform the start streaming.
Perform technical analysis with ease
You can use MarketXLS to create and customize charts with various indicators, trend lines, patterns, and annotations.
You can also use MarketXLS to apply technical analysis functions such as moving averages, MACD, RSI, Bollinger Bands, and more to your data.
MarketXLS lets you customise time periods and moving averages, among others so that you can get a better analysis.
The tool offers you various technical analysis functions such as momentum indicators, cycle indicators, volume indicators, pattern recognition, statistic functions, and price transform functions.
Build and test trading strategies
You can use MarketXLS to create and test your trading strategies with historical data. Moreover, MarketXLS allows you to optimise your strategies with different parameters and criteria.
You can also use MarketXLS to compare and analyze the performance of different strategies.
Also read: Top 7 unblocked games for school
Track and organise your portfolio

As an investor, it is necessary to keep track of your portfolio. MarketXLS does a great job in this aspect.
The tool allows you to analyse risk-return patterns, offers you a wealth index of your portfolio for a stipulated period, and calculates the best returns on your portfolio.
Additionally, you can calculate your monthly returns and get charts and patterns for a more eye-friendly analysis.
All you have to do is use the set of functions and select your portfolio.
Pull in crypto data
If you’re a crypto enthusiast, you can rely on MarkeyXLS, which promises more than 1,200 cryptocurrencies and 9,600 unique combinations for optimum returns. The data is analysed via 17 exchanges.
All you have to do is mention the name of the exchange, and the data will be ready in front of you. You can assess intraday crypto prices, volume averages, historical data, and other technical and analytical indications to secure your crypto investments further.
Moreover, you can download all the reports with just a simple button.
Filter and scan Options

MarketXLS also offer features for Options traders. As an Options trader, you can select a group of stocks in Excel and then see all the Options contracts for the stocks that you have selected.
As there can be thousands of Option contracts on a single stock, it is easy to get overwhelmed. So, to make it easy for Options traders, the company has added an Option Scanner tool using which you can select a range of stocks and then witness all the option contracts.
Historical analysis of data
For a more in-depth analysis of stocks, MarketXLS offers historical stock data for its users.
Users can then select a range of dates or periods to get the values. For intraday trading, MarketXLS offers one-year historical analysis. Additionally, you can research historical dividend data over some time.
Apart from that, MarketXLS also offers more than 400 historical fundamentals of companies from three stock exchanges — the US and Canada, Germany, and London.
Furthermore, you can see the financial statements of the company, including the balance sheet and cash flow, among others.
Also read: Top 7 movies about hackers
In-built utilities and templates
MarketXLS offers various utilities and templates to make life easier for investors. For example, stock valuation templates make it easier to value stocks, DCF valuation, Graham value and more.
The symbol lists allow you to download the symbols of popular indices and exchanges.
The market movers utility gives you a list of the top 100 gainers and losers in the stock market. Moreover, you can share your findings on Twitter instantly and download financial statements, balance sheets, and cash flows with just a click of a button.
Various add-on tools
MarketXLS has partnered with Quotemedia, allowing users to download data bundles from North America, Europe and International data from multiple stock exchanges like Shanghai, Hong Kong, Shenzhen, Bombay, Mexico, Bovespa, Merval, Santiago and Japan.
Select the data bundle to get your password and username in the email. After that, enter the username and password in the settings and then use the functions.
Tons of charts and graphs
Using MarketXLS, you can get readymade and customisable charts based on personal datasets.
You can zoom in and out of the charts, share directly on Twitter or StockTwits, and copy the PNG.
Additionally, the users can annotate Candlestick patterns based on the charts.
In conclusion, MarketXLS is a great software that can be useful for investors and traders. You can use multiple features listed above to enhance your profit chances further.
Also read: 5 ways to make the desktop icons smaller


