Graphs are a primary method of representation of data visually. In a platform such as Matlab, where codes are written, including multiple variables and lots of data, graphs are the primary comparison and representation method.
Many types of graphs can be made in Matlab, such as line plots, bubble and scatter charts, data distribution plots, discrete data plots, geographic plots, polar plots, contour plots, volume visualisation, and many more.
In this article, we’ve covered the following topics.
Also Read: How to make and transpose a Matrix in MATLAB?
Line Plot in MATLAB
Line plots are generally used when data needs to be compared over time. There are six primary categories of line plots in Matlab.
- 2-D Line Plot
- 3-D Line Plot or Point
- Stairstep Graph
- Line Plot with Error Bars
- Filled Area 2-D Plots
- Stacked Plots with common x-axis
2-D Line Plot
2-D Line Plot in Matlab is created using the basic inbuilt function ‘plot(x, y)’, where x and y are both vectors and the graph is y versus the corresponding values of x. Within this function, by just adding another comma, line colour, line width, and many other characteristics can be added to the graph. Consider the example below.

The graph above is a sine graph. Note that the graph has not been modified to change colour, line width or line style. Consider the change in the syntax below with a change in colour, line width, and line style.

The graph here is green as indicated by the ‘g’. The line width considered here is 4, which is written after the keyword ‘LineWidth’, and the line style here is taken to be hyphen-full stop (-.) in alternation mentioned after the keyword ‘LineStyle’.
Adding colour to the graph or changing its width/style can improve the graph’s readability and make it more visible. Adding colour also makes it easier to add and understand the legends in multiple line graphs.
Also read: How to clear the command window in MATLAB?
How to plot multiple lines in a graph?
When coding, it is a requirement to check and compare two or more graphs to understand which is more effective or efficient. In such a case, having multiple separate graphs can make the process very inefficient and tedious, not providing accurate results in the end.

Consider the above example. Here there are two sine graphs but having them on different graphs makes it inconvenient to compare and conclude any result. Matlab makes this easier with the option to plot multiple graphs on the same set of coordinates and the same graph.
Plotting multiple lines
The simplest method to add multiple lines/plots in one graph is using the function ‘hold on’.

As seen from above, using just the simple function ‘hold on’ ensures that all the graphs are in the same plane. The ‘hold on’ function does not need to be mentioned after every graph plotted as it does its work unless the function ‘hold off’ isn’t specified.

There are two graphs above. The first graph consists of three plots and the second graph plotted after the ‘hold off’ command has only one plot on it. This graph could sometimes be misleading due to no legends or x and y-axis labels.

Note how the readability of the graph just enhanced with the minute change in its representation. No matter how many plots are now added to this plot, it will be easy to understand.
Plotting different types of plots
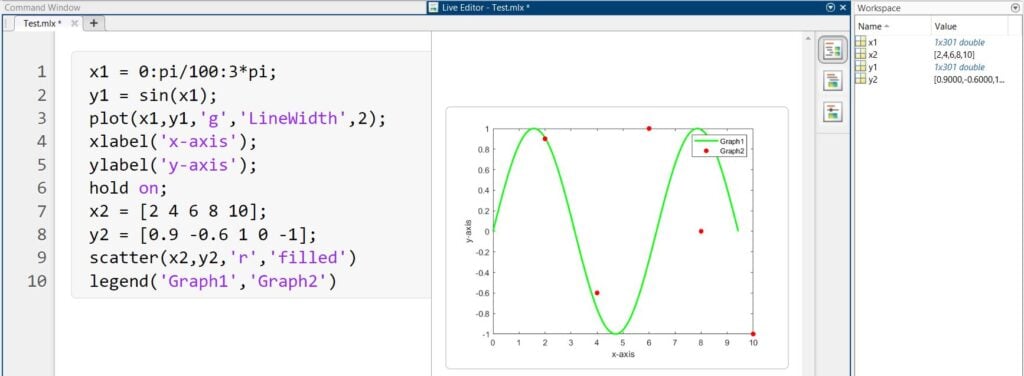
In Matlab, it is possible to mix different types of plots in a single graph as well. The syntax remains the same as it was for the same type of plot.

Here, there is a line plot and a scatter plot plotted on the same graph.
Also Read: How to make a table in MATLAB?


