In Excel, it’s all about how you organise your data. Adding a chart title in Excel is an easy and quick way to improve readability. The chart title helps the viewers find what the chart is about and gives a better understanding of the data presented in the chart. Whether you are creating a chart for a report or a presentation, the chart title plays an essential role in making the chart more effective.
In this article, we have discussed adding and removing a title in an Excel chart in a few simple and easy steps.
How to add a chart title in Excel?
If you have created a chart for your data in the spreadsheet and want to add a chart title in the chart then follow the steps below.
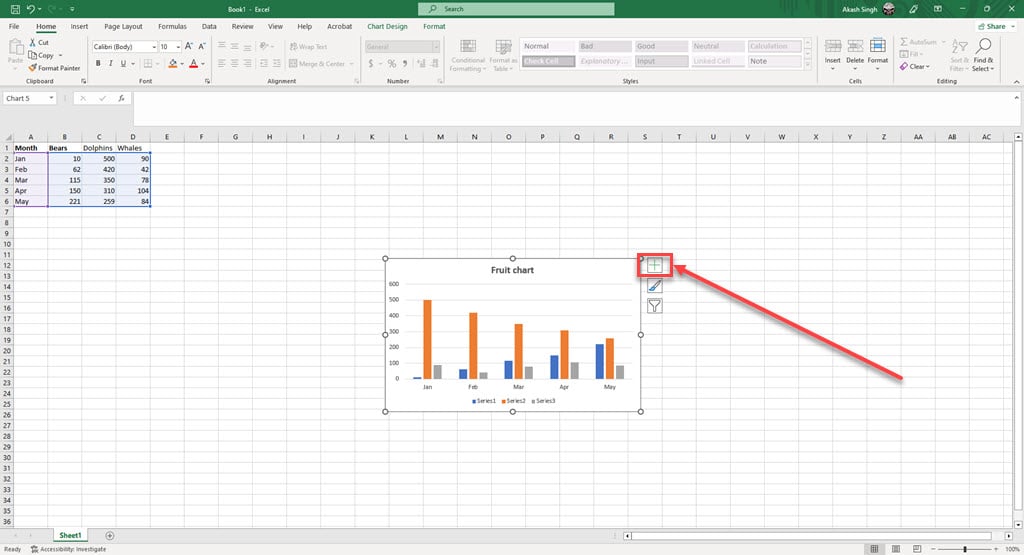
Step 1: Open your document in Excel and click on the chart, and then some options will appear in the top right corner of the chart in your spreadsheet. Click on the Add (Plus sign) icon.

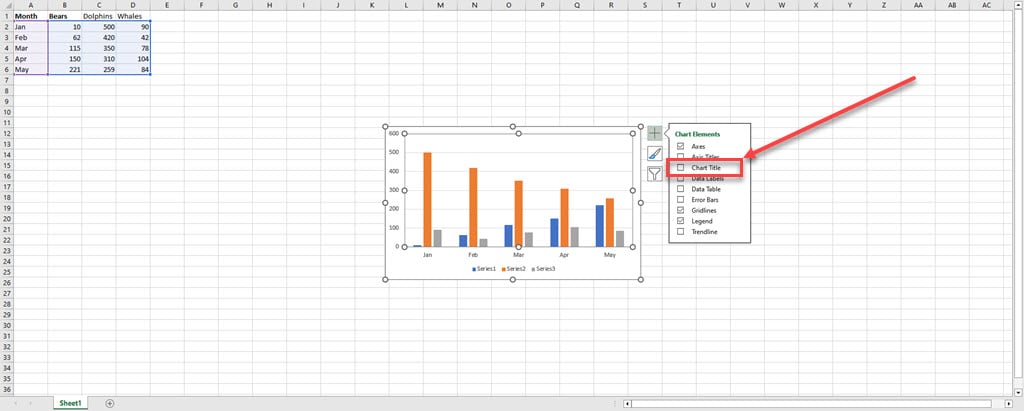
Step 2: In the drop-down menu, check mark the Chart Title option.

Step 3: The chart title will be added to your chart at the top, and you can also edit the chart title.

Also read: How to highlight duplicates in Excel?
How to remove the chart title in Excel?
The steps to remove the chart title from your spreadsheet on Excel are the same as adding a chart title.
Step 1: Open your document in Excel and click on the chart, and then some options will appear in the top right corner of the chart in your spreadsheet. Click on the Add (Plus sign) icon.

Step 2: In the drop-down menu, un mark the checkbox Chart Title.

Step 3: The chart title will be removed from your chart in the spreadsheet on Excel.

Also read: How to fix Excel error: Object variable or with block not set?


